
The 10-year Treasury yield closed at 4.44% on July 14, 2026, after peaking at 4.48% the prior session - up roughly 14 basis points from 4.30% on June 30 (U.S. Treasury daily par yields, July 14, 2026). The 30-year reached 5.08%, its highest level in the 2026 data to that date. The June CPI report, released at 8:30 a.m. on July 14, showed consumer prices falling 0.4% for the month (BLS, July 14, 2026).
Nuv Media publishes information, not financial advice.
Where Does the 10-Year Stand?
At 4.44% on July 14, the 10-year sat near the top of its 2026 range: 3.97% as recently as February 27, 4.45% on May 29, and 4.30% at the end of June before the July climb (U.S. Treasury, 2026). The 2-year finished July 14 at 4.02% after touching 4.12% on July 13, and the 30-year at 5.08% after 5.10% - levels it had not printed in the 2026 series before that week.
The shape of the move matters as much as the level: the selloff concentrated in the longest maturities. From June 30 to July 13, the 30-year rose about 19 basis points against the 10-year's 18, while the 2-year gained 14 - a bear steepening led by the long end.
What Moved Yields in Early July?
Three documented forces lined up. First, the calendar: the Treasury's mid-July coupon auctions returned supply to the market in the week yields accelerated higher (the climb steepened around July 8-13; U.S. Treasury daily data, 2026). Second, the inflation backdrop: the 12-month CPI rate rose to 3.5% in June even as the monthly print fell, because the March energy shock rolled into the annual comparison (BLS, July 14, 2026).
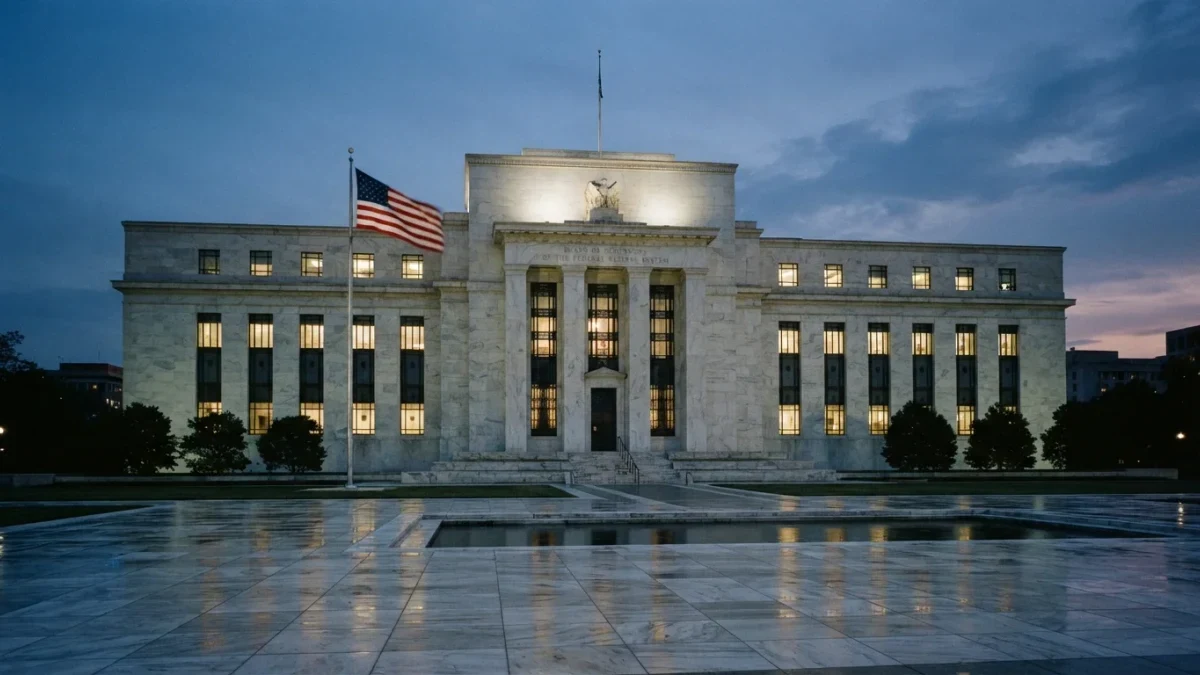
Third, the policy repricing already visible before the CPI: the June 17 FOMC held the range at 3.50%-3.75% unanimously, and the median SEP projection for year-end 2026 sat at 3.8%, at the top of the current range (Federal Reserve, June 17, 2026). The 2-year yield rising from 3.98% to 4.12% between June 30 and July 13 is the front-end expression of that same repricing.
What Did the June CPI Report Show?
Headline CPI fell 0.4% in June on a seasonally adjusted basis - the largest one-month decrease since April 2020 - while core CPI was unchanged at 0.0%. Over 12 months, headline ran at 3.5% and core at 2.6% (BLS, July 14, 2026).
Energy drove the monthly drop: the index fell 5.7%, with gasoline down 9.7%, after the run-up that had lifted energy prices 15.7% year over year. Shelter rose just 0.1% for the month - the smallest change since January 2021 - and food rose 0.2%. On the release day itself, the 10-year closed 4 basis points below its prior-session peak (U.S. Treasury, July 13-14, 2026).
How Does This Feed Into Borrowing Costs?
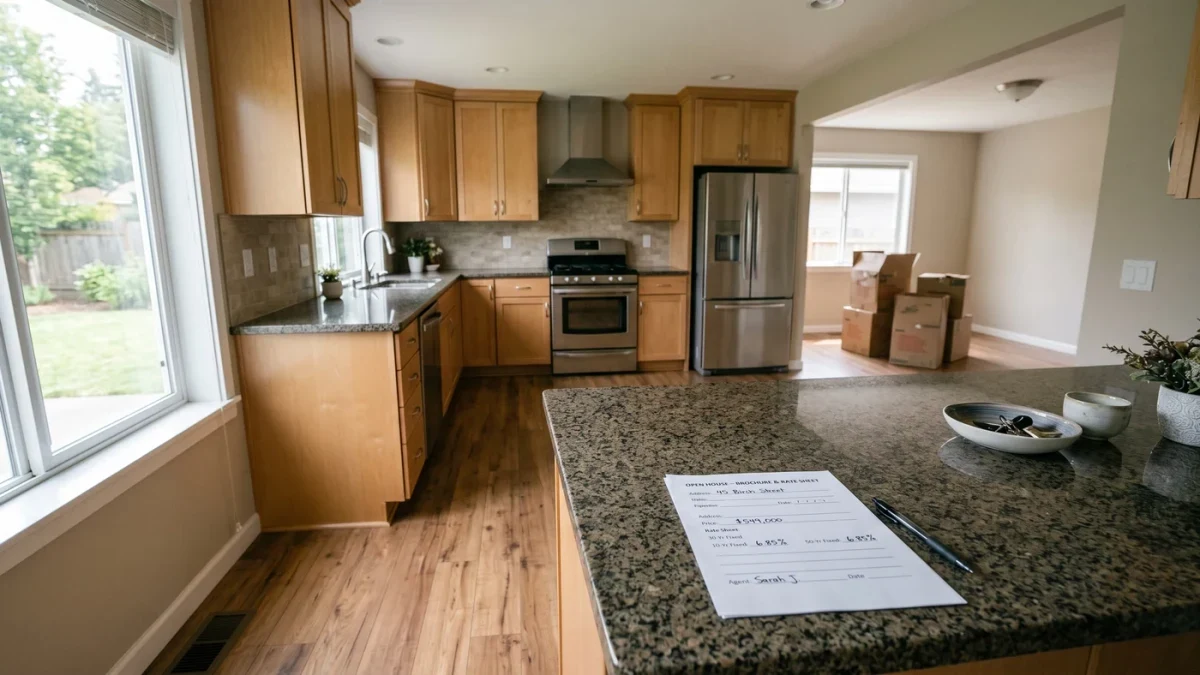
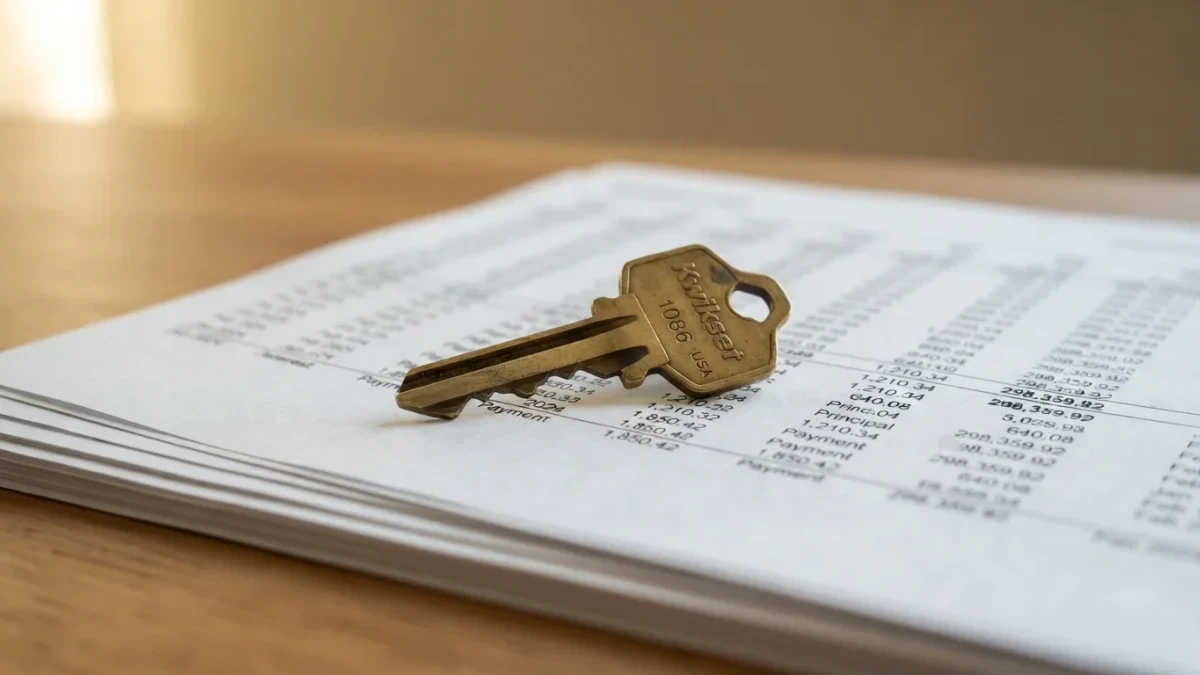
The 10-year is the pricing anchor for long-term credit. Thirty-year mortgages have recently carried a spread of roughly 2.1 percentage points over it - 6.53% on Freddie Mac's survey against a 4.45% 10-year in late May (Freddie Mac PMMS; U.S. Treasury, May 2026). Corporate bonds quote as spreads over Treasuries, so a higher benchmark lifts new-issue coupons mechanically unless spreads compress.
Consumers touch the 10-year through the fixed side of the credit stack: mortgages, auto loan securitizations, student refinancing. The floating side - cards at prime, HELOCs, variable private loans - keys off the policy rate, which has not moved since December 2025 (Federal Reserve, 2026). July's yield move repriced the first group and left the second untouched.
What Comes Next on the Calendar?
The next scheduled FOMC meeting falls in late July, per the Federal Reserve's published 2026 calendar, with the policy range still 3.50%-3.75% until the Committee says otherwise. Treasury's auction calendar continues its monthly cycle of coupon supply.
This article reports where yields stood through July 14, 2026 and what the released data contained. It offers no forecast for the next auction, the next CPI print or the next FOMC decision, and no view on positioning.