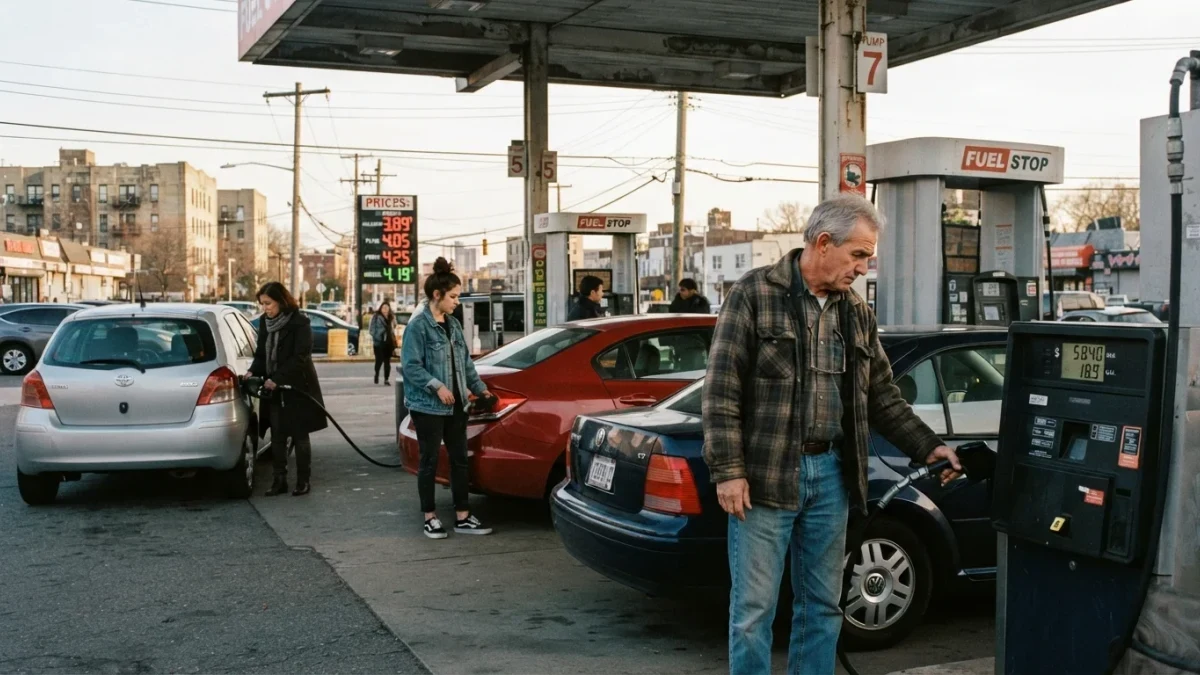
Consumer prices rose 0.9% in March on a seasonally adjusted basis, lifting the 12-month CPI rate to 3.3%, the Bureau of Labor Statistics reported on April 10, 2026. Gasoline jumped 21.2% in a single month - the largest increase since the series began in 1967 - and accounted for roughly three-quarters of the all-items rise (BLS, April 10, 2026).
Nuv Media publishes information, not financial advice.
What Did Headline and Core CPI Do?
The split is the story. Headline CPI rose 0.9% for the month and 3.3% over 12 months, while core CPI - all items less food and energy - rose 0.2% for the month and 2.6% over the year (BLS, April 10, 2026). The gap between those two monthly prints is almost entirely an energy phenomenon, not a broad repricing of the basket.
A 0.9% monthly headline move is large by the standards of the series. It is the kind of reading that mechanical annualization would translate into double-digit rates - and also the kind that energy-driven spikes have historically reversed when the source shock fades. Both facts describe the arithmetic, not a forecast.
What Drove the Monthly Jump?
Energy rose 10.9% in March, the largest monthly increase since September 2005 (BLS, April 10, 2026). Within that, gasoline rose 21.2% and fuel oil 30.7%, while electricity rose 0.8% and utility gas service fell 0.9%. Energy overall stands 12.5% higher than a year earlier.
The concentration matters for interpretation. With gasoline contributing about three-quarters of the all-items monthly increase, the remainder of the basket rose at a pace far closer to the core reading of 0.2%. Payments and pricing teams index to headline and core separately for exactly this reason: one series moved on oil, the other barely moved at all.
What Did the Non-Energy Side Show?
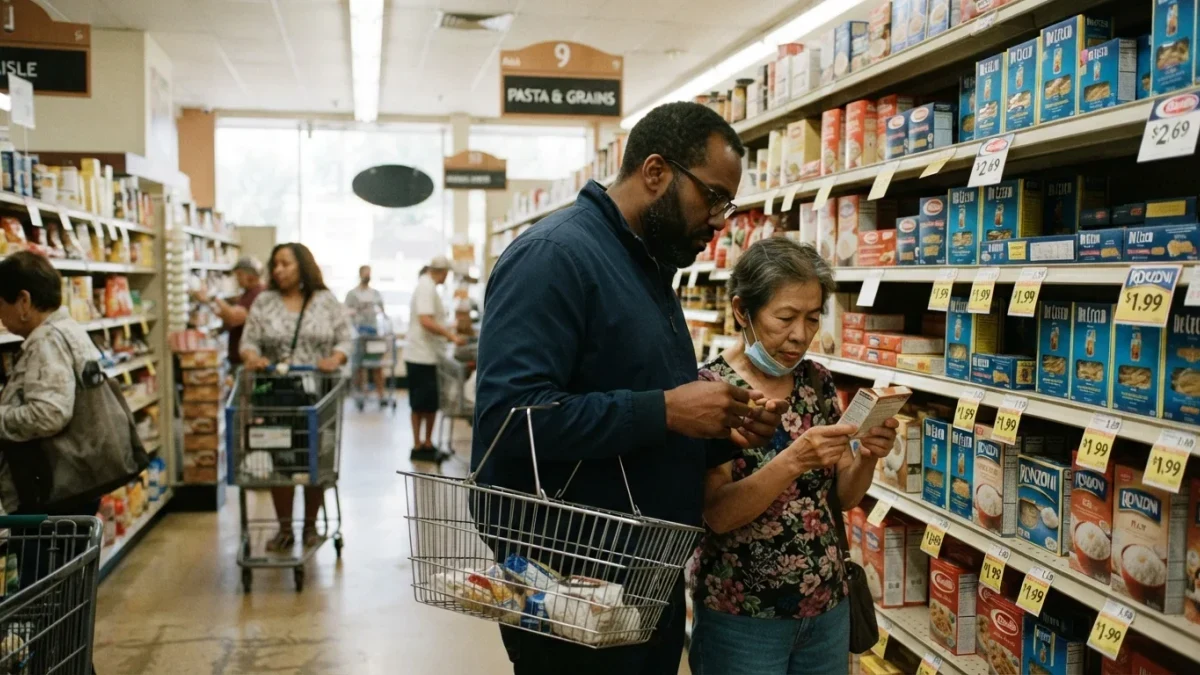
Food was flat in March, with food at home down 0.2% and food away from home up 0.2%; food is up 2.7% over 12 months. Egg prices, a flashpoint of 2025 coverage, fell 3.4% for the month and 44.7% year over year (BLS, April 10, 2026).
Shelter rose 0.3% for the month and 3.0% over the year - still above the all-items core pace, as it has been throughout the cycle. Used cars and trucks fell 0.4% monthly and 3.2% annually. Airline fares rose 2.7% in March and 14.9% over the year, apparel rose 1.0%, and medical care slipped 0.2% with prescription drugs down 1.5%.
What Is the Caveat Inside the Data?
The release notes that October and November 2025 index values are missing because of the 2025 lapse in appropriations - the government shutdown disrupted BLS collection schedules (BLS, April 10, 2026). Twelve-month comparisons pass through those months, and the BLS methodology for bridging the gap is documented in the release itself.
For anyone benchmarking contracts or index-linked pricing to CPI, the practical consequence is to read the 3.3% annual figure with the gap in mind rather than treat it as a clean 12-month observation. The monthly figures in this release rest on the March 2026 collection round.
What Does This Mean for Payments and Banking Teams?
Directly, nothing in this release reprices a deposit or a card - deposit rates key off the policy rate and card APRs key off prime, which both stood unchanged through the Fed's January and March 2026 holds (Federal Reserve, 2026). Indirectly, CPI is the input the FOMC names in every statement, and March delivered a headline spike alongside a tame core.
This article reports a data release already published. It offers no view on the next FOMC meeting, no market call, and no product recommendation; those decisions belong to readers and their own analysis.