
An inverted yield curve preceded every U.S. recession dated by the National Bureau of Economic Research since 1969, a record documented in Federal Reserve Bank of New York research (Estrella and Mishkin, 1996). As of February 27, 2026, the curve is not inverted: the 10-year Treasury yielded 3.97% against 3.67% for the 3-month bill (U.S. Treasury daily par yields, February 27, 2026).
Nuv Media publishes information, not financial advice.
What Is a Yield Curve Inversion?
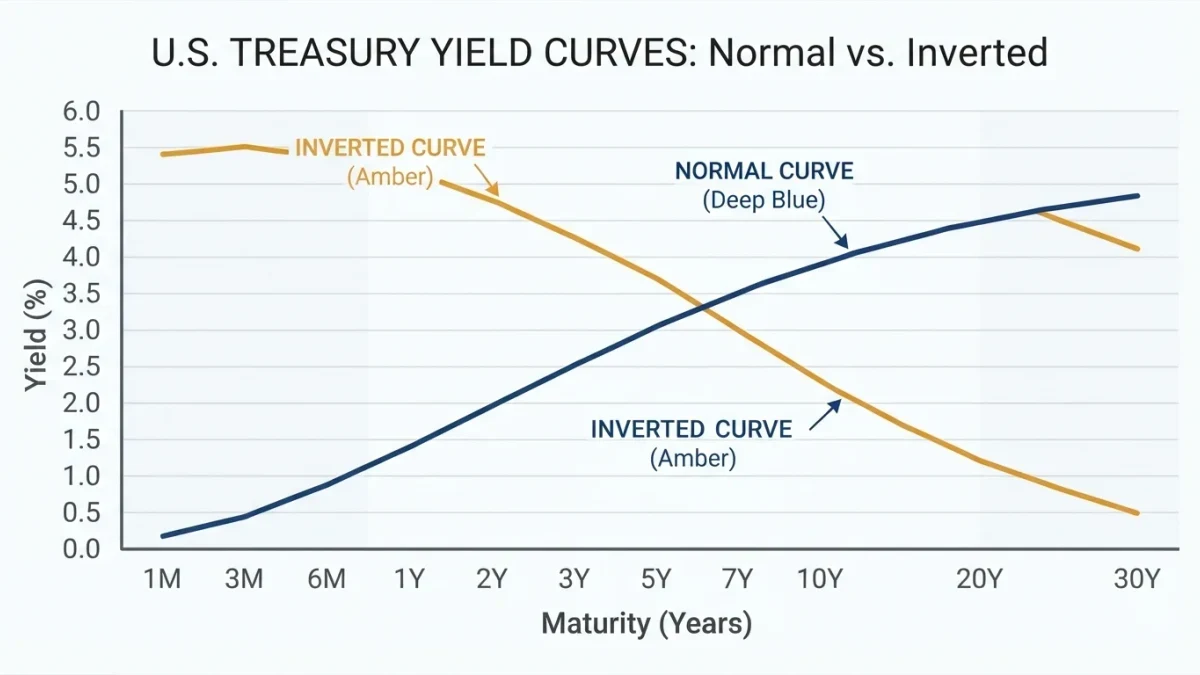
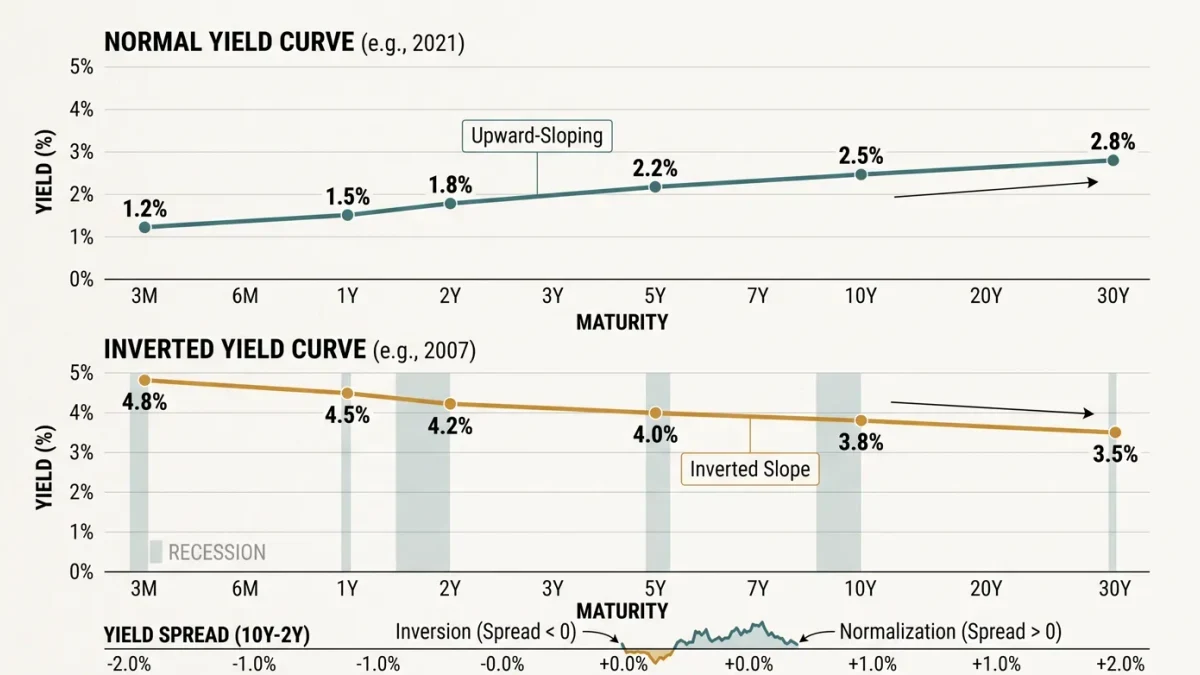
Normally, lending money for longer pays more, so the Treasury curve slopes upward. An inversion flips that: a short-dated security yields more than a long-dated one, which means markets are being paid less to lock money up for years. The two standard gauges are the 10-year minus 3-month spread (10y-3m) and the 10-year minus 2-year spread (10y-2y).
An inversion is not a statement that a recession has begun. It is a priced expectation: policy rates are high now, and the bond market is building in lower short rates later. Long yields embed the average of expected future short rates plus a term premium, so when the expectation component falls far enough, the curve turns down at the front.
Why Have Inversions Preceded Recessions?
The mechanism runs through policy. The Fed tightens until the overnight rate sits above expected future rates; that same tightness eventually slows credit and hiring. The curve simply records where the policy rate stands against the market's view of where it goes next. The empirical record is the reason the indicator is watched at all.
| Inversion began (10-year vs short maturity) | NBER recession began |
|---|---|
| 1968 | December 1969 |
| 1973 | November 1973 |
| 1978 | January 1980 |
| 1980 | July 1981 |
| 1989 | July 1990 |
| 2000 | March 2001 |
| 2006 | December 2007 |
| 2019 | February 2020 |
Two caveats belong in the same breath. The lag has run from several months to two years, and the 2020 recession followed the 2019 inversion by way of a pandemic, which is the weakest test case in the set. The pattern is strong; the timing is loose (Treasury data; NBER business cycle dating, 1968-2020).
What Did the 2022-2024 Inversion Actually Signal?
The 10y-2y spread inverted in April 2022 and the 10y-3m followed in late October 2022, as the Fed raised its target range toward 5.25%-5.50% (Federal Reserve, 2022-2023). The 10y-2y gap reached roughly -1.1 percentage points in July 2023, among the deepest readings in decades of Treasury data (U.S. Treasury daily par yields, 2023).
The Federal Reserve Bank of New York's recession-probability model, which reads the near-term forward spread, put the 12-month recession probability above 50% during that stretch - levels last seen in the early 1980s (FRBNY, 2023-2024). No NBER-dated recession had been declared through early 2026, and both spreads returned to positive territory during the second half of 2024 as the policy rate came down (U.S. Treasury daily data, 2024).
The episode is the live test of the indicator's limits: a deep, long inversion, a widely followed model at multi-decade highs, and a labor market that slowed without, so far, an official contraction. That is exactly why professionals treat the signal as one input rather than a verdict.
What Does the Curve Look Like As of February 2026?
Upward-sloping, and steeply so at the long end. On February 27, 2026, par yields ran: 3-month 3.67%, 1-year 3.48%, 2-year 3.38%, 5-year 3.51%, 10-year 3.97%, 30-year 4.64% (U.S. Treasury, February 27, 2026). That puts 10y-3m near +0.30 percentage points and 10y-2y near +0.59 percentage points - positive, i.e., un-inverted.
One nuance sits at the very front: the 1-month bill yielded 3.74%, above the 3-month at 3.67%, and bill yields below the policy range's midpoint reflect the market's pricing of the near-term policy path (U.S. Treasury, February 27, 2026). Front-end shape and full-curve shape answer different questions; the recession literature rests on the latter.
The steepness between the 2-year and 10-year - roughly 0.59 percentage points on the same date - reverses the arithmetic of the inversion years, when that gap sat near or below zero (U.S. Treasury, 2023-2026). A positive spread of this size is the configuration in which the classic signal is dormant: the market can price future policy moves lower while long yields still outcompete the front of the curve.
What Are the Signal's Limits?
First, false or ambiguous triggers: the curve inverted briefly in 1998 without an NBER recession, and 1966 saw an inversion followed by a credit crunch rather than a dated contraction. Second, the lag problem: six months to two years is too wide for any operational use without other inputs.
Third, the term-premium problem. The spread mixes expectations with compensation for holding long bonds, and quantitative easing, reserve abundance and global demand for duration all compress the premium. A curve that inverts partly for technical reasons is not carrying the same message as one inverted purely by policy expectations (Estrella-Mishkin framework and subsequent FRBNY research, 1996-2022).
Fourth, an inversion tells you nothing about depth or sector. It has preceded mild and severe downturns alike, and it says nothing about which part of the credit stack breaks first.
Which Spread Should You Watch, 10y-3m or 10y-2y?
Both, for different reasons. The 10y-3m has the longer documented track record in the Estrella-Mishkin tradition; the 10y-2y is quoted more widely in markets and tends to invert earlier in a tightening cycle. Federal Reserve staff research also uses the near-term forward spread - the 3-month rate one year forward versus today's 3-month - which isolates the expected policy path over the next twelve months (FRBNY, 2022).
The practical routine is mechanical: pull the Treasury's daily par yield curve (treasury.gov), compute the spreads, and read them alongside hiring, credit and earnings data. The curve is the market's priced expectation, not a decree - and nothing in this article is a forecast of what it does next.