
US banks earned their spread the old-fashioned way through 2025: the FDIC's Quarterly Banking Profile put the industry's net interest margin at 3.35 percent in the third quarter of 2025, up two basis points from a year earlier. That ratio compresses the entire deposit business into one number: what assets yield, minus what funding costs.
Nuv Media publishes information, not financial advice.
What Does Net Interest Margin Actually Measure?
Net interest margin is annualized net interest income divided by average earning assets. Net interest income is what a bank earns on loans and securities minus what it pays on deposits and borrowings. The FDIC reported a 3.35 percent NIM for all insured institutions in the third quarter of 2025, which means the industry earned roughly 3.35 cents of spread per dollar of earning assets, annualized.
The margin is not the same as profit. Staff, branches, technology, provisions for loan losses, and taxes all come out of interest income before net income. NIM isolates one question: how well does the institution convert funding into interest-earning assets?
How Does a Bank Set the Rate on a Deposit?
A deposit rate is a funding decision, not a marketing gift. Treasury and asset-liability committees price deposits against the marginal cost of the alternatives: Federal Home Loan Bank advances, brokered deposits, and wholesale funding. A bank pays a retail rate only when it is cheaper, or stickier, than those substitutes.
Three practical levers move the posted rate. First, the policy rate: the Federal Reserve lowered the federal funds target range to 3.50 to 3.75 percent in December 2025, per the Fed's open market operations record, and deposit pricing follows that anchor with a lag. Second, liquidity needs: a bank growing loans faster than deposits pays up. Third, rate sensitivity, which traders call deposit beta — the share of a policy-rate change a bank passes through to savers.
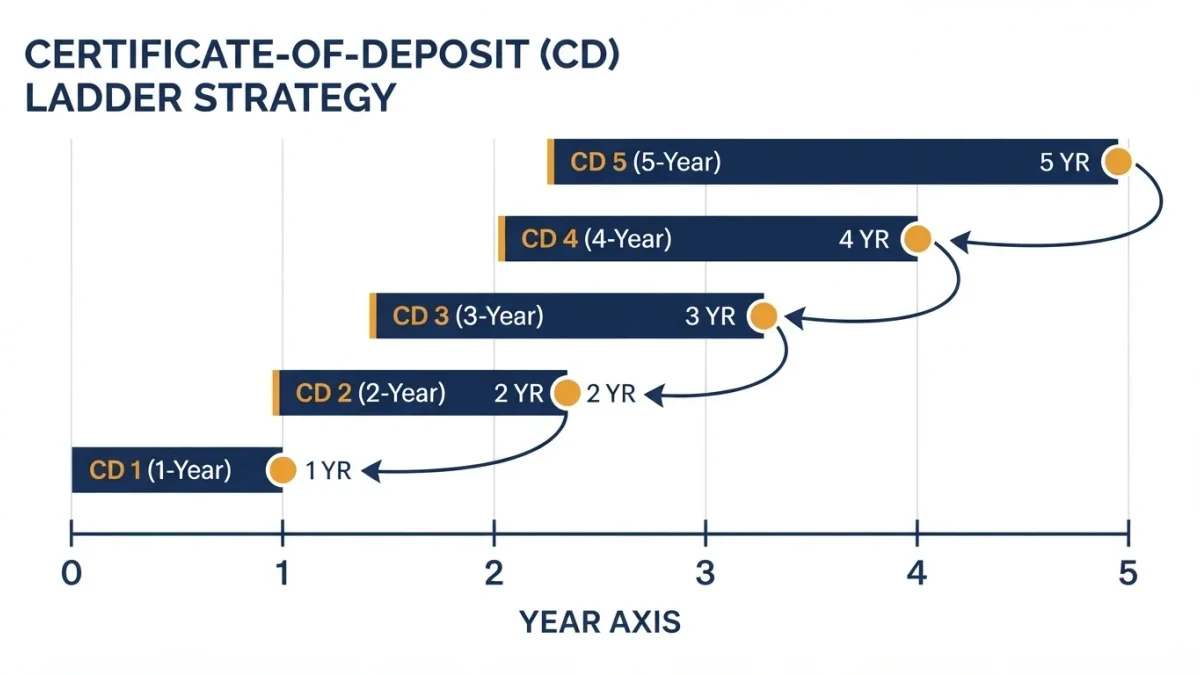
Checking deposits typically carry the lowest beta, because balances are held for payments convenience. Savings and money market accounts reprice faster, and certificates of deposit reprice only at maturity, which is why banks pay a premium for term deposits when they expect rates to fall.
Why Do Branch Banks and Online Banks Pay Different Rates?
Cost structure, not generosity, sets the gap. A branch network pays for real estate, staffing, and cash handling before it pays a saver. An online bank replaces those fixed costs with rate, because the advertised APY is its main acquisition channel. Two institutions facing identical wholesale funding costs can rationally post very different retail rates.
There is also a customer-selection effect. Branch banks aggregate large volumes of low-beta checking balances that rarely leave, which weakens the incentive to bid for rate-sensitive money. Online banks attract exactly the depositors who comparison-shop, so competition among them compresses the spread they can keep. The FDIC's deposit insurance applies equally to both channels — the standard limit is 250,000 dollars per depositor, per bank, per ownership category — so insurance does not drive the difference.
What Sits on the Other Side of the Spread?
The asset side decides whether the funding is worth having. Commercial and industrial loans, mortgages, credit card receivables, and securities each carry different yields and different durations. A bank funded at 2 percent that lends at 6 percent earns a wide margin but books the duration mismatch; the FDIC's quarterly data shows the industry balancing this continuously, with the NIM moving in basis-point steps rather than jumps.
Loan mix explains why two banks with identical deposit costs report very different margins. Card-heavy and commercial lenders run wider spreads than mortgage- and securities-heavy balance sheets, and the same funding can flip from cheap to expensive when the mix shifts. Asset quality completes the picture: a margin earned on souring loans is not a margin for long, which is why the FDIC reports provisioning costs alongside NIM.
What Does the FDIC Quarterly Data Show?
The Quarterly Banking Profile is the primary public record of the spread business. It aggregates call-report data from every FDIC-insured institution roughly two months after quarter-end, and it breaks NIM out by bank size category. In the third quarter of 2025 the industry NIM stood at 3.35 percent, two basis points higher than a year earlier, per the FDIC.
The same series shows the cycle. Margin fell to multi-decade lows while the federal funds rate sat near zero in 2020 and 2021, then expanded sharply as the Fed raised rates through 2022 and 2023, per FDIC quarterly data. For professionals, the useful read is the second derivative: NIM stabilizing near 3.3 to 3.4 percent through 2025 tells you deposit costs and asset yields were repricing at nearly the same speed.
When Does the Spread Turn Against a Bank?
Duration mismatch is the classic failure mode. If deposits reprice in weeks while assets are fixed for years, a rising-rate cycle compresses the margin and a falling-rate cycle strands funding costs. Silicon Valley Bank failed on March 10, 2023 after depositors pulled 42 billion dollars in a single day, with roughly 100 billion more queued for the next morning, per congressional testimony from Federal Reserve Vice Chair for Supervision Michael Barr in March 2023.
SVB was not a lending collapse; it was a spread-management collapse. Long-dated securities bought at low yields lost market value as rates rose, and rate-sensitive uninsured deposits left faster than losses could be absorbed. The lesson the industry took: the price of a deposit includes how quickly that deposit can reprice or run, and the FDIC's quarterly NIM series is the first place that pressure becomes visible.