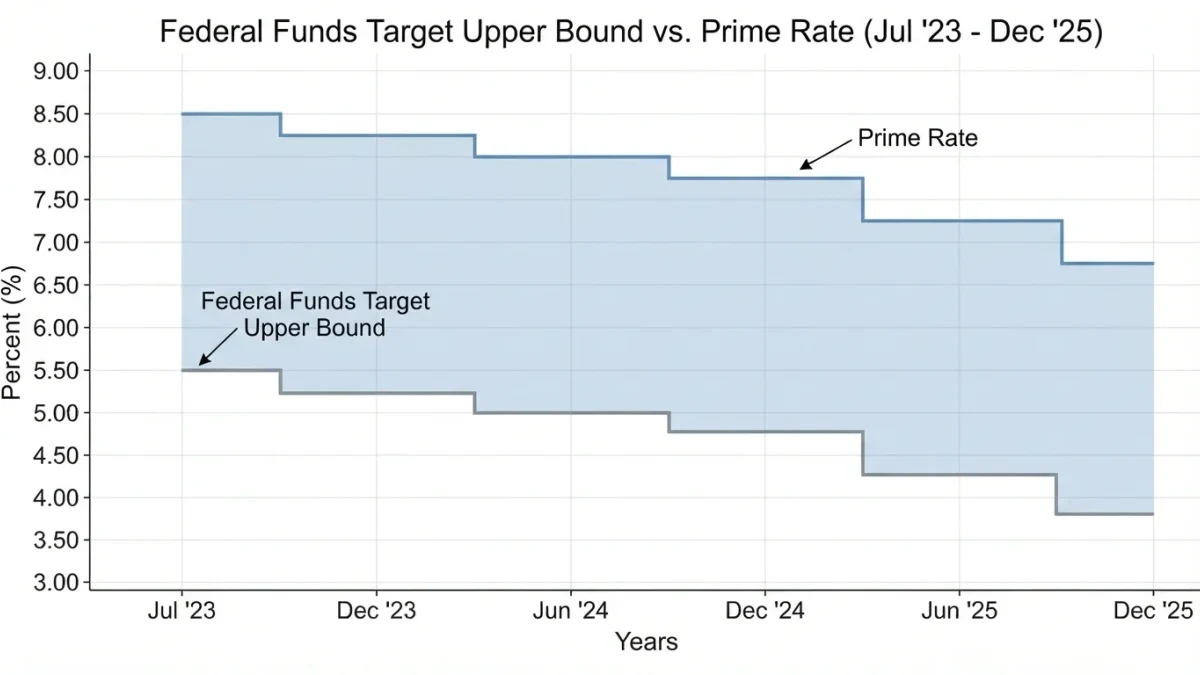

The Federal Reserve lowered its federal funds target range to 3.50%-3.75% on December 10, 2025, its third cut of the year (Federal Reserve, December 2025). The FDIC national average rate on savings has stayed below 0.5% through the entire cycle (FDIC Monthly National Rates, 2025). The gap between those two numbers is deposit-rate transmission in practice.
Nuv Media publishes information, not financial advice.
What Does the Fed Funds Rate Actually Set?
The federal funds rate is the overnight price at which banks lend reserves to each other, and the FOMC sets only a target range for it. The Fed holds the effective rate inside the range with administered rates, including interest on reserve balances (Federal Reserve, 2025). No consumer deposit rate is set by the Fed at any bank.
Deposit pricing is a bank-level decision driven by funding needs, loan growth and competition. That is how a 3.50%-3.75% target range coexists with a national average savings rate under 0.5% (FDIC, 2025). The policy rate moves banks' marginal funding costs; each bank then decides what it pays you, and when.
The transmission chain runs: policy range, effective overnight rate, banks' funding costs, deposit offers. Every link after the first is discretionary, which is why the last link moves slowest.
How Quickly Do Rate Cuts Reach Savings Accounts?
Slowly, by discretion rather than rule. In the 2022-2023 tightening, floating loan rates repriced within one or two billing cycles, while the FDIC national average savings rate rose only into the mid-0.4% range even as the target range went from 0.00%-0.25% to 5.25%-5.50% between March 2022 and July 2023 (Federal Reserve, 2023; FDIC Monthly National Rates, 2024).
Cuts travel the same road in reverse. A bank that funds loans with deposits protects net interest income by repricing savings late - as long as balances stay. Analysts summarize this with the deposit beta, the share of a policy move that reaches a deposit rate. Betas below one are normal; the FDIC averages are the public record of that shortfall.
The mechanics of the lag are mundane. Savings rates change at the bank's pricing desk and apply on statement dates; money market account tiers reset on their own schedules; and the effect of a cut only fully registers once balances have rolled through those cycles. The FDIC's monthly series smooths all of it into one average, which is why single-day reaction reading is mostly theater.
| Product | Repricing mechanism | Speed after a policy move |
|---|---|---|
| Variable savings | Bank discretion, applied at statement cycle | Weeks to months |
| Money market fund | Holdings roll into new short-term rates | Days to weeks |
| Existing CD | Fixed until maturity | No change until term ends |
| New-issue CD | Priced at each issuance | Days |
Why Do Online Banks Pay More Than Branch Banks?
Because their deposits cost less to hold and are recruited by rate rather than convenience. A branch network adds fixed cost per location, and branch deposits are sticky, so they carry lower rates. Online banks price closer to wholesale funding alternatives because rate comparison is the only tool that attracts the balances they need.
The FDIC averages make the spread measurable rather than anecdotal: compare any account's APY against the published national average for its product (FDIC Monthly National Rates, 2025). Online offerings have repeatedly sat at multiples of that average during both the tightening and the easing phases, which is the observable signature of the two pricing models.
Promotional pricing sits on top. Banks defend specific deposit segments with time-limited rates, most often on CDs, without moving the headline savings rate for everyone else. That is marketing of funding, not transmission of policy.
Where Do Money Market Funds Fit In?
Money market funds reprice almost immediately because they hold short-dated paper - Treasury bills, repo, commercial paper - that rolls over constantly. Savings accounts do not reprice themselves at all. After a policy move, fund yields follow within weeks, which sets the reference point for rate-sensitive depositors deciding where a balance earns more (Investment Company Institute, 2024).
The scale matters: U.S. money market fund assets have held above $6 trillion since 2024 (Investment Company Institute, 2024). That pool is the exit option for deposit balances, and its yield is why banks with sticky customers can lag while banks with mobile customers cannot.
How Do CD Rates Respond When the Fed Cuts?
A CD fixes its rate on the issue date, so an existing CD feels a cut only at maturity. New-issue CDs reprice continuously, because banks adjust term rates to control how much funding they lock in and for how long. That split makes the CD shelf the clearest place to watch transmission as it happens.
Early-withdrawal penalties are the other half of the product. Breaking a CD typically costs a defined number of months of interest, which is the price of having locked a rate at all. Penalty schedules, not headline APYs, determine what the fix is worth if personal circumstances change mid-term.
What Is the FDIC Monthly National Rate Good For?
It is the cleanest public benchmark for what an average U.S. depositor actually earns. The FDIC publishes national averages each month for savings, money market, interest checking and CD terms, along with rate caps that restrict what less well capitalized institutions may pay (FDIC Monthly National Rates, 2025). Aggregators show offers; the FDIC series shows the paid average.
For professionals, the monthly release is a lagging scoreboard for transmission: it tells you how much of a policy move reached depositors, product by product, with monthly granularity and no marketing noise.
What Should You Track Beyond the FOMC Headline?
Three series do most of the work: the FDIC monthly national rates, the Federal Reserve's daily effective fed funds rate, and the deposit-cost lines in bank quarterly filings. Read together, they show the policy decision, the market rate that implemented it, and what each institution reports its funding costs - the full transmission chain after the fact.
None of these series predicts the next FOMC decision, and this article does not either. What they document is how a policy range becomes, or fails to become, the yield on a specific account balance - with dates, so the lag is verifiable each cycle.